

This is a link to my Tableau Public page where I have posted a few of my dashboard reports. They include a dasboard that tracks and
summarizes COVID-19 cases in NYC and an analysis of shooting incidents in NYC. Feedbacks are appreciated and welcomed.
Using SQL queries, this analysis tracks monthly and year-to-date tax collections for the
current fiscal year. It then measures revenue performance by comparing actual collections
to projections and to collections from the prior fiscal year.

This analysis uses logistic regressions to evaluate the difference in college
enrollment odds among black students. Using Current Population Survey data from IPUMS,
the analysis is conducted using R Programming.

This project uses various SQL functions to explore a mulitnational organization's
database to determine the differences that exist among its employees in terms of salary.
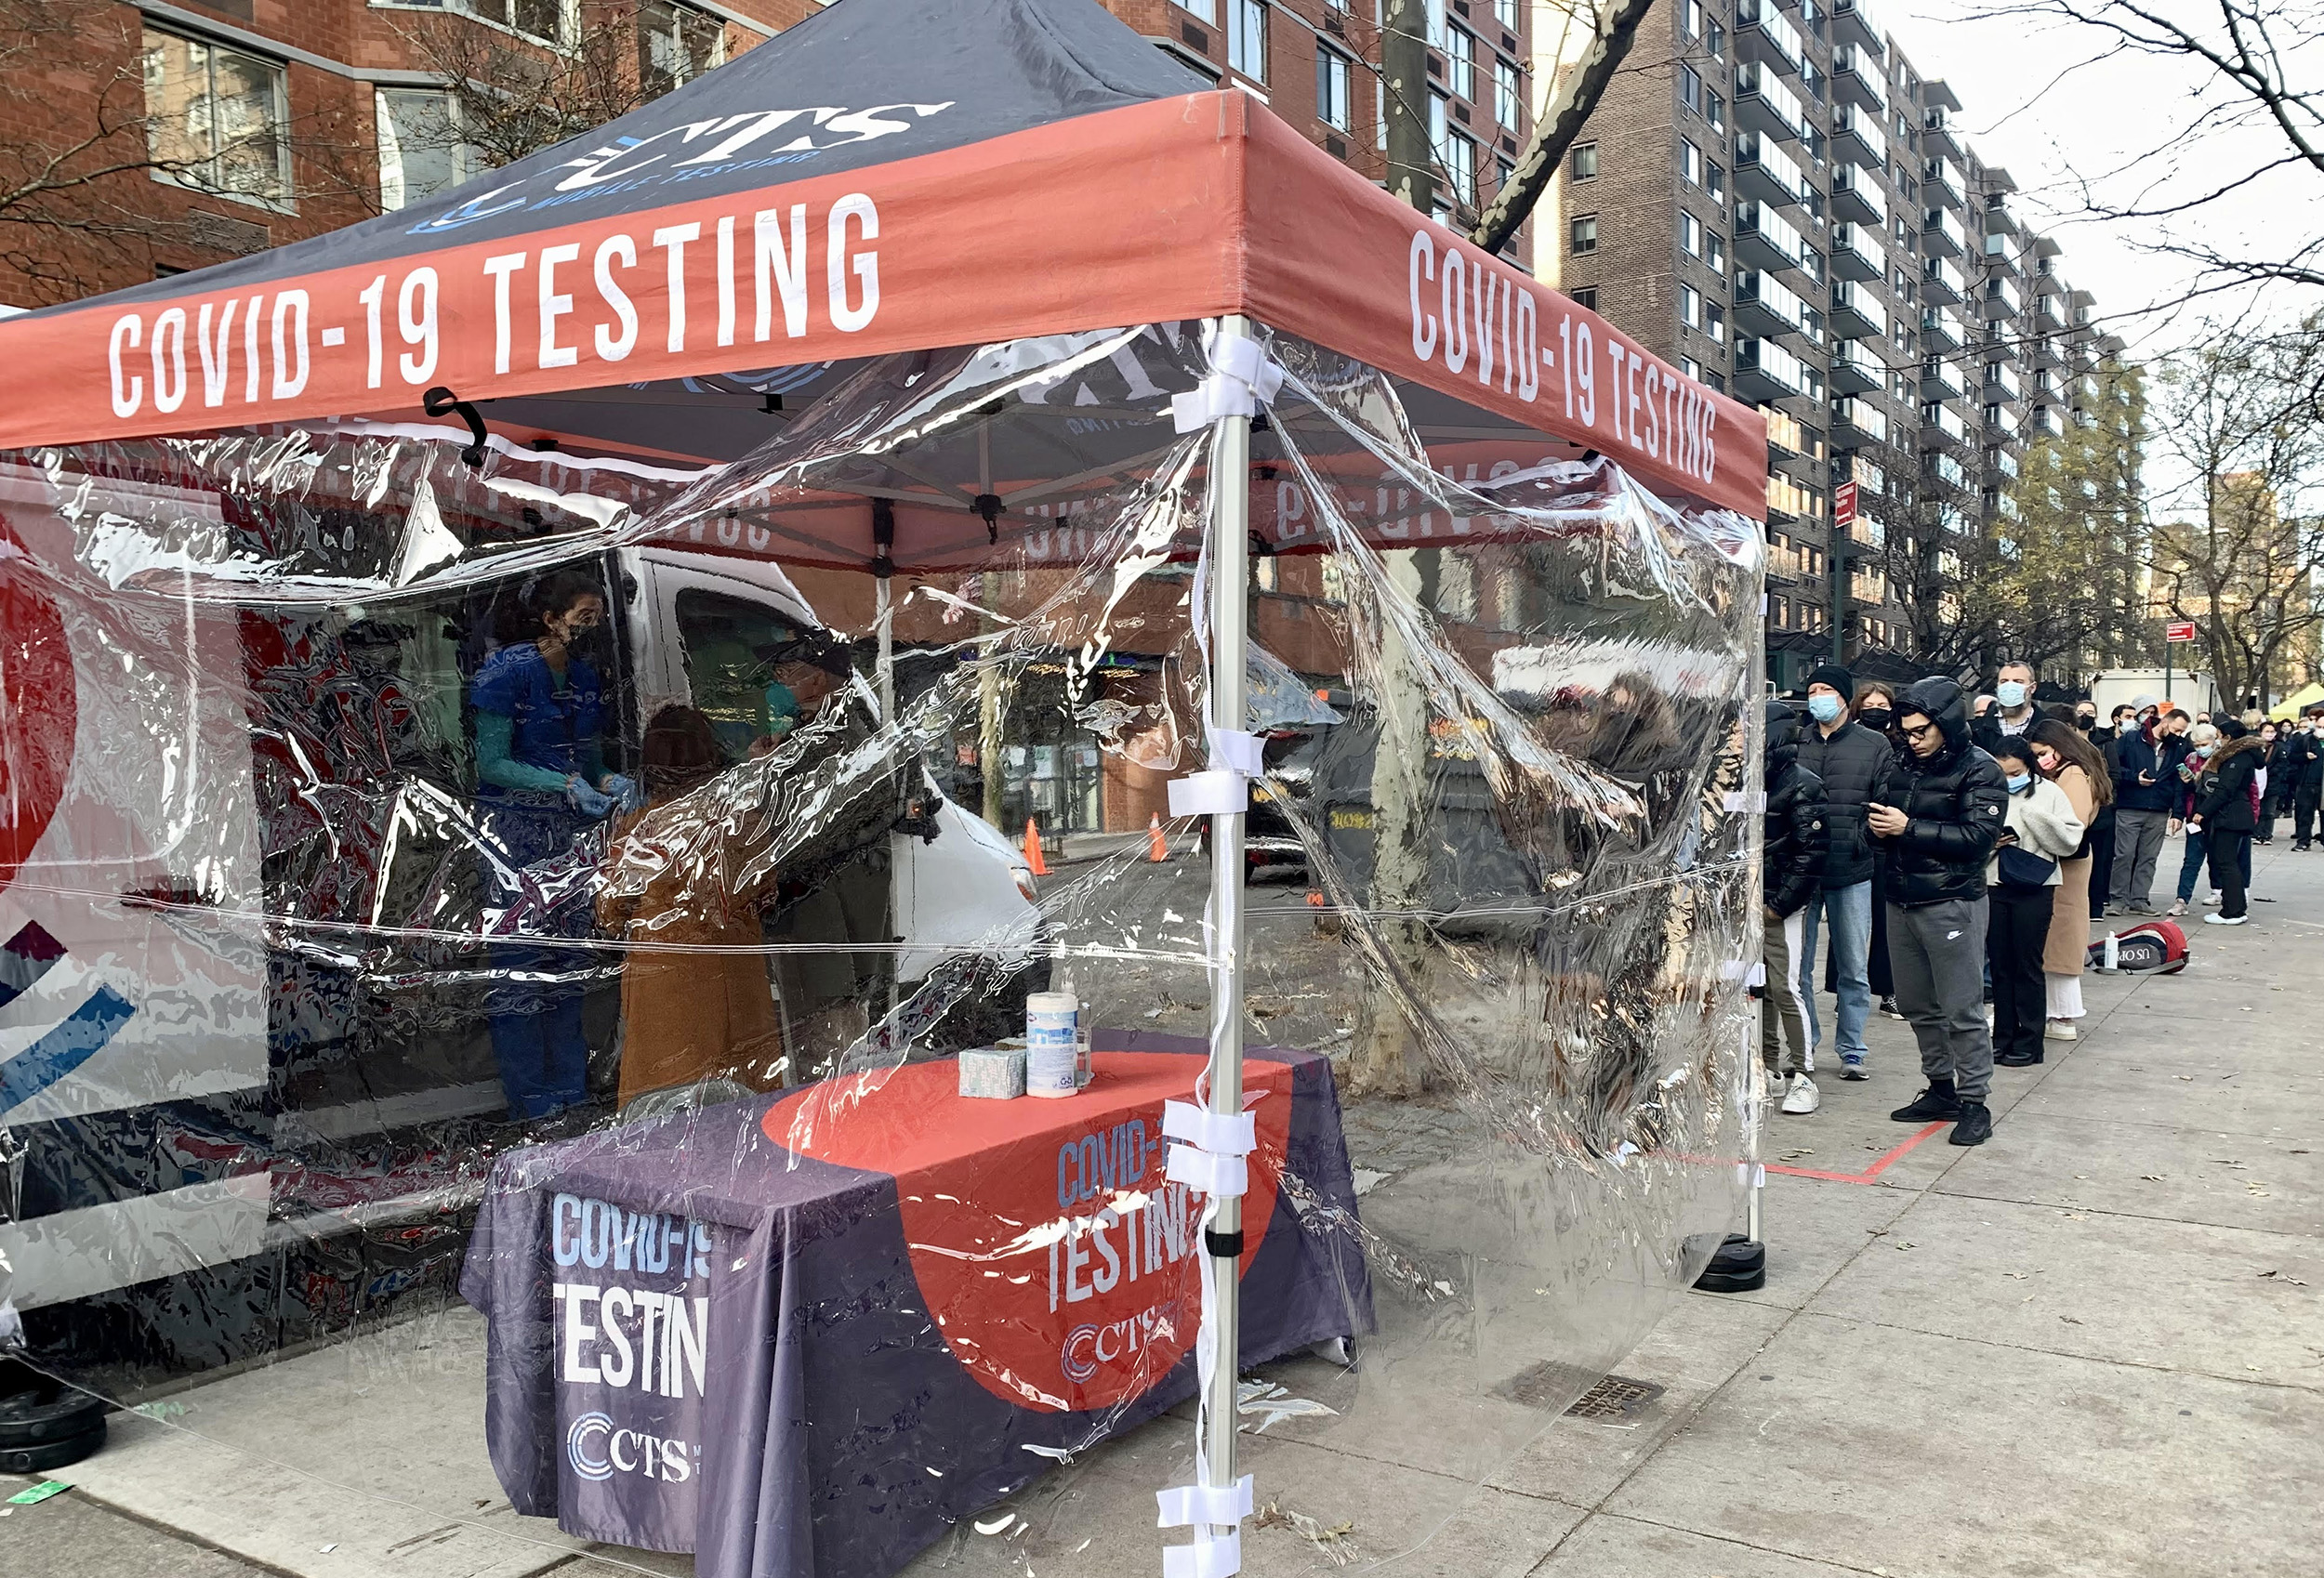
This is a weekly updated project that utilizes publicly available data from the
NYC Department of Health & Mental Hygiene to analyze reported COVID-19 cases in NYC.
It analyzes and visualizes the daily and total number of infections, hospitalizations and deaths in NYC
since the pandemic. It also highlights the differences in cases among different demographics in the City.
This analysis is accompanied by a Tableau dashboard which can be accessed through
the Tableau Public link provided above.

This project analyzes the differences in neighborhoods characteristics in New York City using estimates
from the American Community Survey and spatial data of NYC neighborhoods.
Using choropleth maps generated from R, it highlights the disparities in race/ethnicity, educational and
poverty levels among the different NYC neighborhoods.

This work seeks to determine if DOF's property appraisals meet the standards set by the International Association
of Assessing Officers (IAAO). Using property sales and assessment data, it estimates the assessment-sale ratio
and use it to measure how close DOF's market values are to true market value (sale prices).
Additionally, the project evaluates how uniform the assessment-sales ratio are across the City and within
groups by calculating the coefficient of dispersion.